Portugal: from bailout to quiet recovery In 2011 Portugal needed a bailout from the EU and the IMF. Since then it has cut its debt and grown steadily, while Eastern Europe has caught up with it.
November 17, 2026 · Numbers update automatically with the latest data
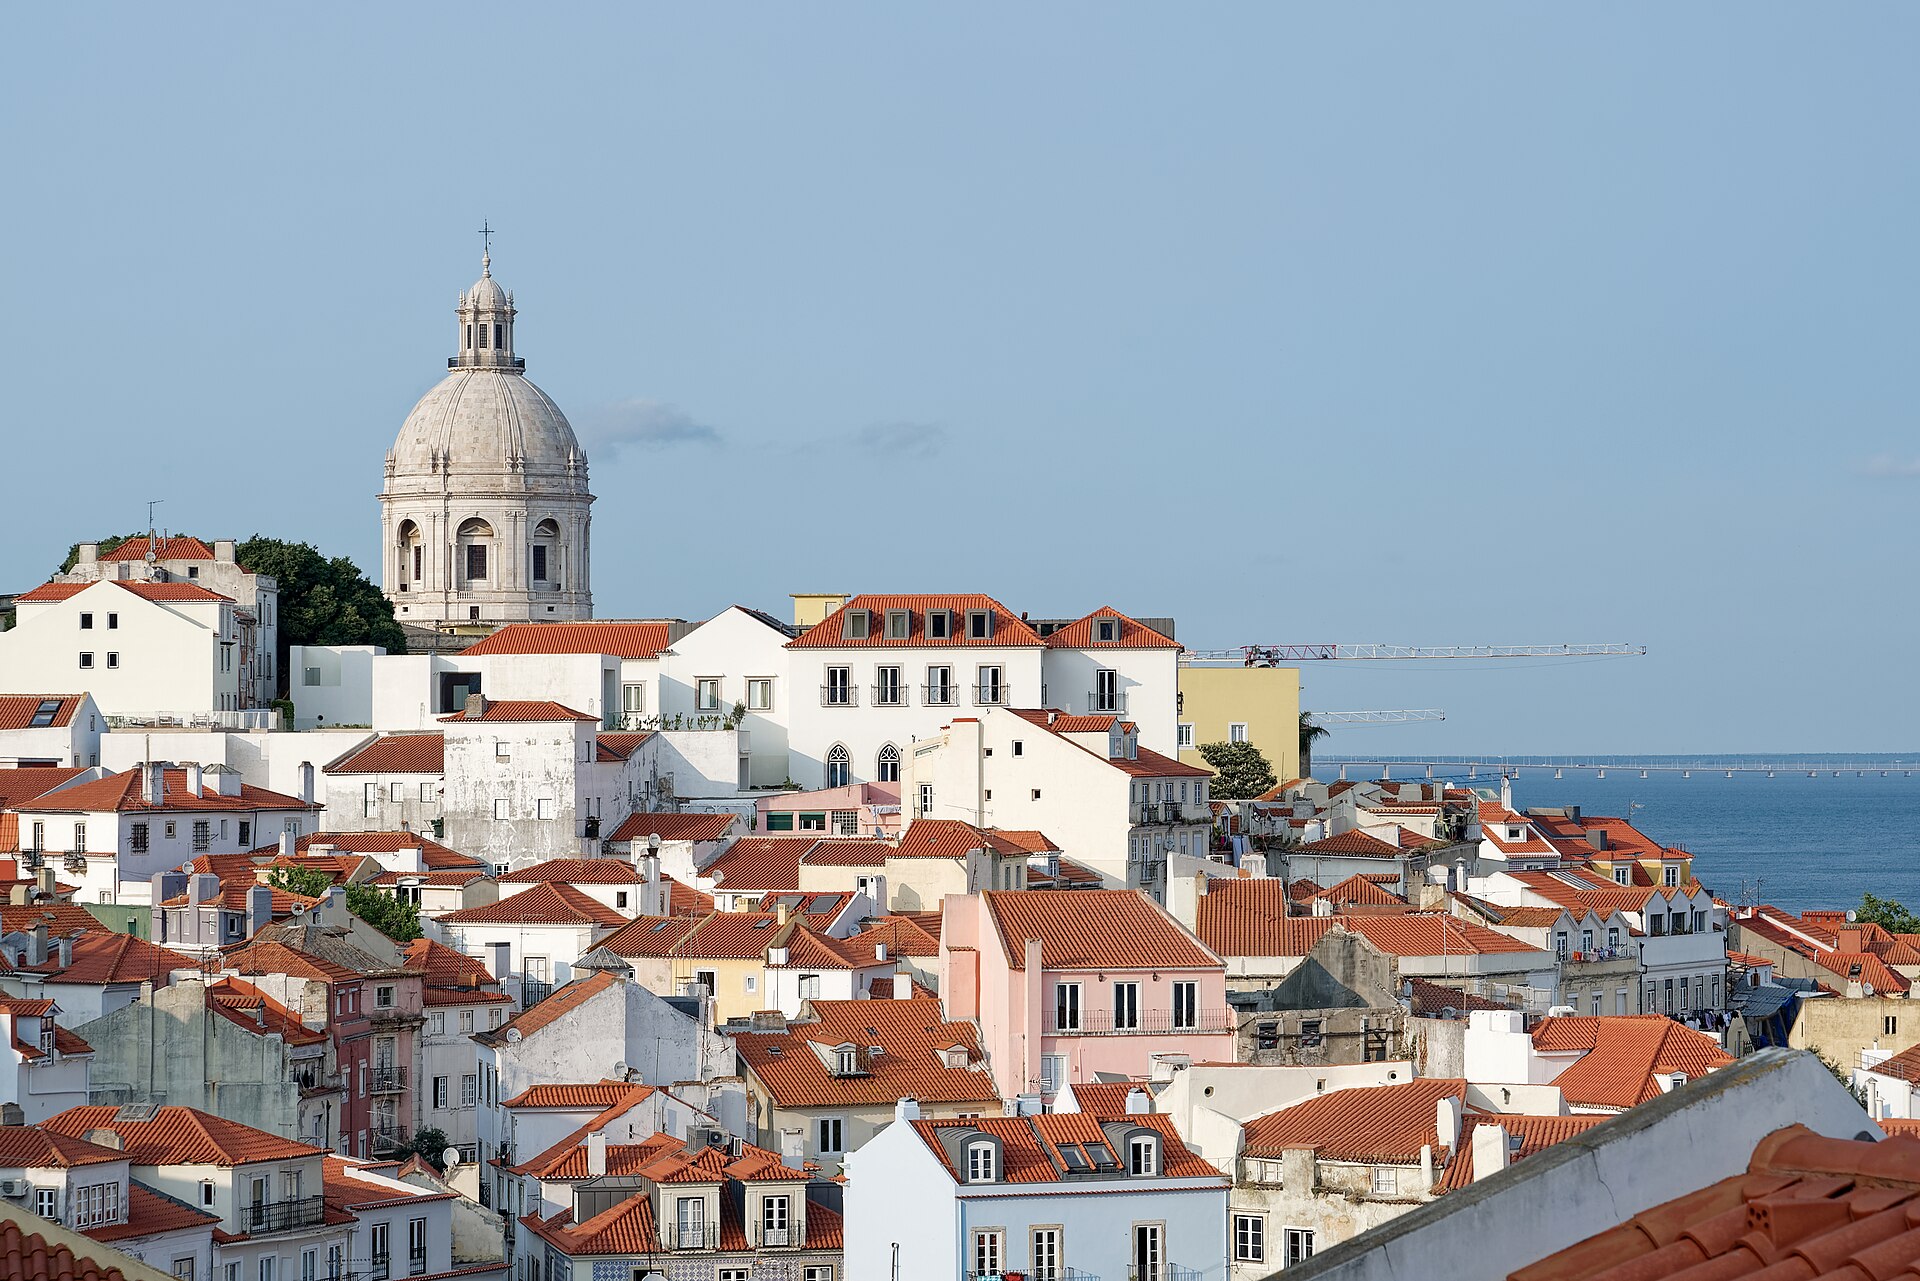
Photo: Jakub Hałun · Wikimedia Commons · CC BY 4.0 In 2011 Portugal could no longer borrow at affordable rates and received a €78 billion rescue package. The years of austerity that followed were painful: wages were cut and many young people emigrated.
$0 $10,000 $20,000 $30,000 $40,000 $50,000 $60,000 $70,000 2000 2004 2008 2012 2016 2020 2025 Portugal 2000: $18,883 Portugal 2001: $19,528 Portugal 2002: $20,356 Portugal 2003: $20,849 Portugal 2004: $21,475 Portugal 2005: $22,726 Portugal 2006: $24,678 Portugal 2007: $25,738 Portugal 2008: $26,666 Portugal 2009: $26,473 Portugal 2010: $27,292 Portugal 2011: $26,802 Portugal 2012: $26,476 Portugal 2013: $27,967 Portugal 2014: $28,765 Portugal 2015: $29,608 Portugal 2016: $31,591 Portugal 2017: $32,972 Portugal 2018: $34,896 Portugal 2019: $37,867 Portugal 2020: $35,967 Portugal 2021: $38,657 Portugal 2022: $45,251 Portugal 2023: $49,801 Portugal 2024: $52,511 Portugal 2025: $53,145 Spain 2000: $21,582 Spain 2001: $22,953 Spain 2002: $24,378 Spain 2003: $25,057 Spain 2004: $26,160 Spain 2005: $27,630 Spain 2006: $30,749 Spain 2007: $32,536 Spain 2008: $33,350 Spain 2009: $32,218 Spain 2010: $31,805 Spain 2011: $32,015 Spain 2012: $31,870 Spain 2013: $32,614 Spain 2014: $33,761 Spain 2015: $35,229 Spain 2016: $37,613 Spain 2017: $39,825 Spain 2018: $41,015 Spain 2019: $44,042 Spain 2020: $39,328 Spain 2021: $44,251 Spain 2022: $51,483 Spain 2023: $55,661 Spain 2024: $58,064 Spain 2025: $59,868 Greece 2000: $18,820 Greece 2001: $20,304 Greece 2002: $21,985 Greece 2003: $23,253 Greece 2004: $24,826 Greece 2005: $25,005 Greece 2006: $28,077 Greece 2007: $28,897 Greece 2008: $30,441 Greece 2009: $29,963 Greece 2010: $27,840 Greece 2011: $25,692 Greece 2012: $24,583 Greece 2013: $25,731 Greece 2014: $26,451 Greece 2015: $26,607 Greece 2016: $27,504 Greece 2017: $28,681 Greece 2018: $29,792 Greece 2019: $31,926 Greece 2020: $29,532 Greece 2021: $33,529 Greece 2022: $39,447 Greece 2023: $42,615 Greece 2024: $44,172 Greece 2025: $45,263 Poland 2000: $10,721 Poland 2001: $11,175 Poland 2002: $11,841 Poland 2003: $12,329 Poland 2004: $13,413 Poland 2005: $13,936 Poland 2006: $15,205 Poland 2007: $16,833 Poland 2008: $18,372 Poland 2009: $19,300 Poland 2010: $20,991 Poland 2011: $22,809 Poland 2012: $23,728 Poland 2013: $24,434 Poland 2014: $25,460 Poland 2015: $26,988 Poland 2016: $28,360 Poland 2017: $30,170 Poland 2018: $32,345 Poland 2019: $35,883 Poland 2020: $37,089 Poland 2021: $41,059 Poland 2022: $46,777 Poland 2023: $48,474 Poland 2024: $51,263 Poland 2025: $54,262 Spain Poland Portugal Greece $0 $10,000 $20,000 $30,000 $40,000 $50,000 $60,000 $70,000 2000 2008 2016 2025 Portugal 2000: $18,883 Portugal 2001: $19,528 Portugal 2002: $20,356 Portugal 2003: $20,849 Portugal 2004: $21,475 Portugal 2005: $22,726 Portugal 2006: $24,678 Portugal 2007: $25,738 Portugal 2008: $26,666 Portugal 2009: $26,473 Portugal 2010: $27,292 Portugal 2011: $26,802 Portugal 2012: $26,476 Portugal 2013: $27,967 Portugal 2014: $28,765 Portugal 2015: $29,608 Portugal 2016: $31,591 Portugal 2017: $32,972 Portugal 2018: $34,896 Portugal 2019: $37,867 Portugal 2020: $35,967 Portugal 2021: $38,657 Portugal 2022: $45,251 Portugal 2023: $49,801 Portugal 2024: $52,511 Portugal 2025: $53,145 Spain 2000: $21,582 Spain 2001: $22,953 Spain 2002: $24,378 Spain 2003: $25,057 Spain 2004: $26,160 Spain 2005: $27,630 Spain 2006: $30,749 Spain 2007: $32,536 Spain 2008: $33,350 Spain 2009: $32,218 Spain 2010: $31,805 Spain 2011: $32,015 Spain 2012: $31,870 Spain 2013: $32,614 Spain 2014: $33,761 Spain 2015: $35,229 Spain 2016: $37,613 Spain 2017: $39,825 Spain 2018: $41,015 Spain 2019: $44,042 Spain 2020: $39,328 Spain 2021: $44,251 Spain 2022: $51,483 Spain 2023: $55,661 Spain 2024: $58,064 Spain 2025: $59,868 Greece 2000: $18,820 Greece 2001: $20,304 Greece 2002: $21,985 Greece 2003: $23,253 Greece 2004: $24,826 Greece 2005: $25,005 Greece 2006: $28,077 Greece 2007: $28,897 Greece 2008: $30,441 Greece 2009: $29,963 Greece 2010: $27,840 Greece 2011: $25,692 Greece 2012: $24,583 Greece 2013: $25,731 Greece 2014: $26,451 Greece 2015: $26,607 Greece 2016: $27,504 Greece 2017: $28,681 Greece 2018: $29,792 Greece 2019: $31,926 Greece 2020: $29,532 Greece 2021: $33,529 Greece 2022: $39,447 Greece 2023: $42,615 Greece 2024: $44,172 Greece 2025: $45,263 Poland 2000: $10,721 Poland 2001: $11,175 Poland 2002: $11,841 Poland 2003: $12,329 Poland 2004: $13,413 Poland 2005: $13,936 Poland 2006: $15,205 Poland 2007: $16,833 Poland 2008: $18,372 Poland 2009: $19,300 Poland 2010: $20,991 Poland 2011: $22,809 Poland 2012: $23,728 Poland 2013: $24,434 Poland 2014: $25,460 Poland 2015: $26,988 Poland 2016: $28,360 Poland 2017: $30,170 Poland 2018: $32,345 Poland 2019: $35,883 Poland 2020: $37,089 Poland 2021: $41,059 Poland 2022: $46,777 Poland 2023: $48,474 Poland 2024: $51,263 Poland 2025: $54,262 Spain Poland Portugal Greece GDP per person (PPP) · 2000–2025 · Open in the interactive tool → Steady since 2014
Tourism, exports and foreign investment helped Portugal recover. Government debt has fallen to about 89.7% of GDP, from well above 120% a decade ago.
A new comparison
Adjusted for prices, Portugal now has a GDP per person of $53,145 1.8× as rich as Poland ; today the two are almost level (102% ). For Portugal, the new neighbours in the EU ranking are in the east.
Source: World Bank, World Development Indicators (CC BY 4.0). Latest year: 2025.